Welcome - and thank you for helping us get close to 300 readers. That number isn’t huge, but it’s a community of people who genuinely care about improving how investment decisions get made. If you know someone like that, please pass this along.
In this edition, we’ll unpack an analysis that’s become one of my go-to methods over the years - a simple yet powerful way to sharpen your due diligence process.
So let’s get started.
/ Self-promotion
Want to systematize your private markets approach? FundFrame helps you move from spreadsheets to rigorous, repeatable frameworks.
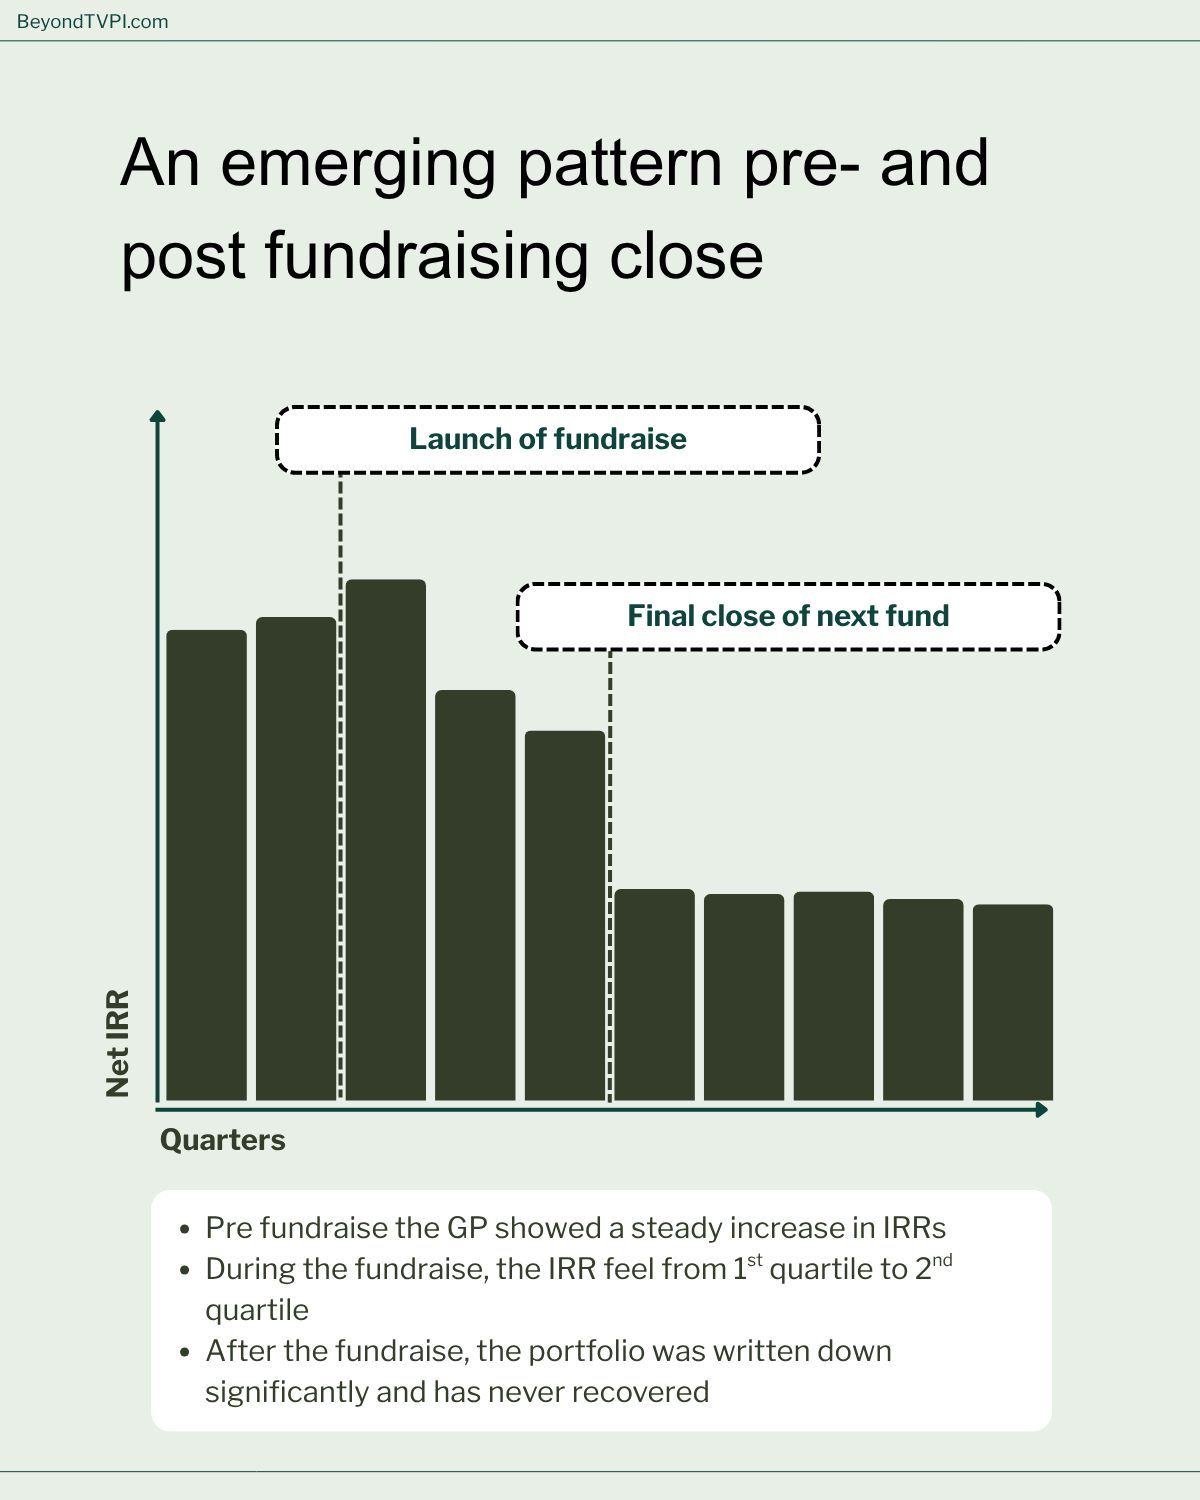
We’ve all seen it - when IRR and TVPI drops right after fundraising
A few years ago, we were evaluating a re-up with a manager. Strong track record, good relationship, no obvious red flags.
Then we ran the Entry Multiple Test.
We compared what they’d paid for each portfolio company to their current marks. The pattern was hard to miss: systematic write-ups across most of the portfolio - 1–2 turns of multiple expansion despite flat or even declining revenue growth. No operational improvements that could justify the uplift.
We passed on the re-up.
When we ran the same analysis on the fund we were already invested in, what looked like a top second-quartile performer suddenly looked bottom quartile.
The manager went on to close an oversubscribed raise, doubling in size. Plenty of LPs looked at the same data and said yes - and to be fair, we debated it internally. I wanted to back them; I’d known them for years. But the data was undeniable.

This is the actual values (slightly randomized to protect anonymity) of the GP in question
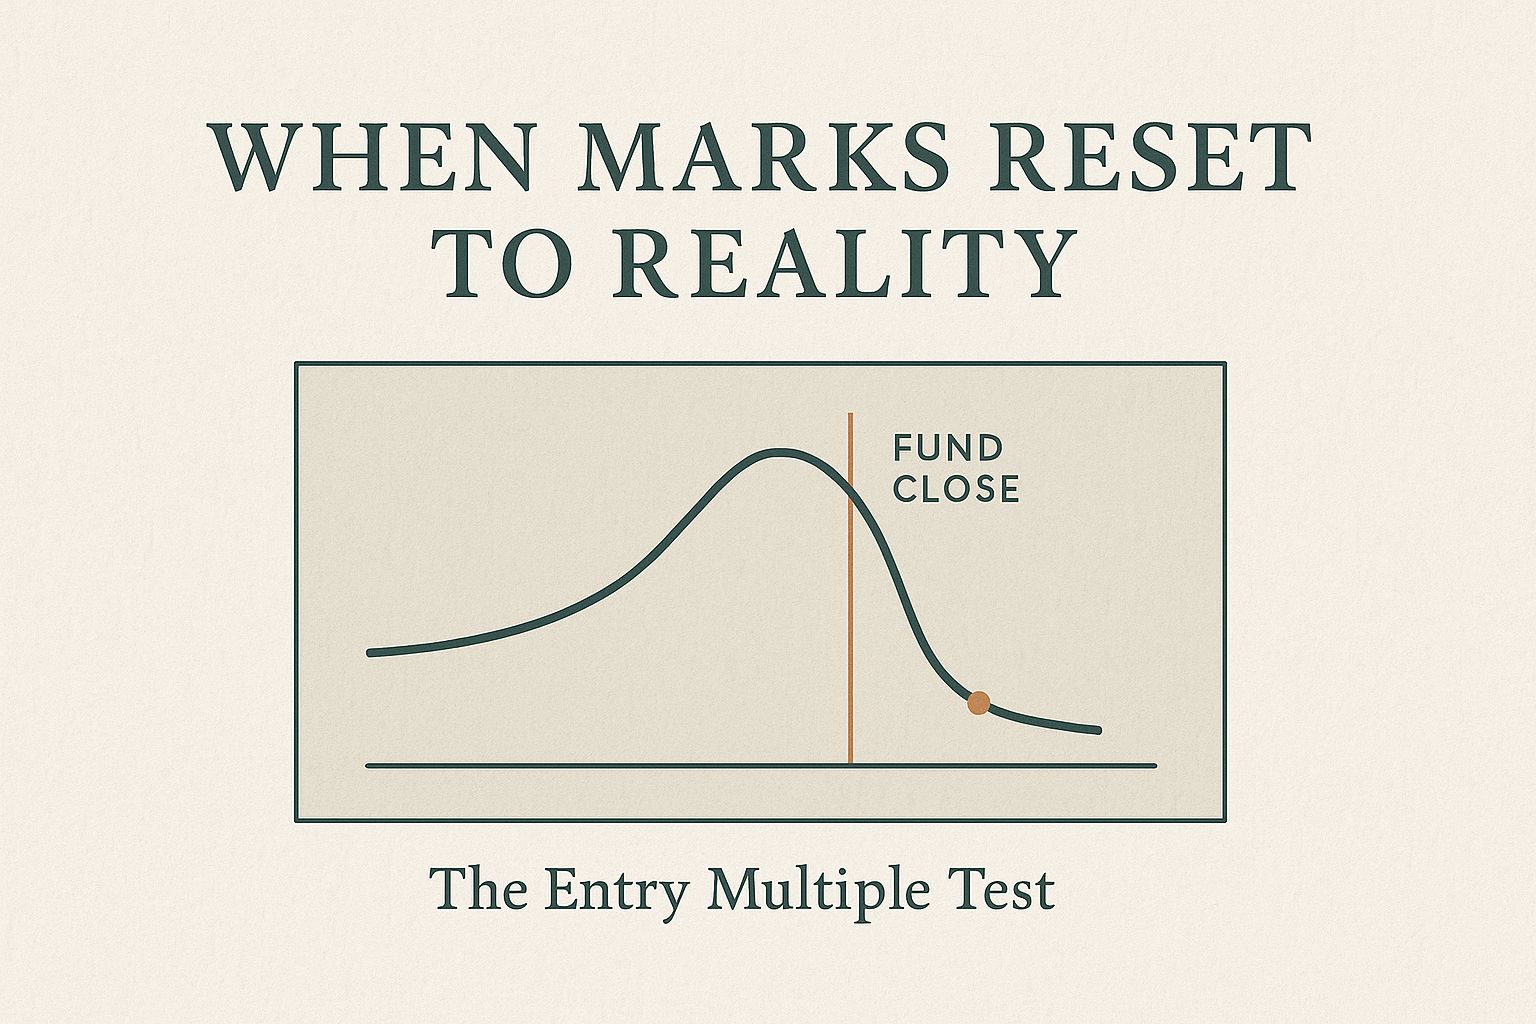
Then, right after final close? Marks reset to reality. The companies once held at 1.1x were now 0.75x.
This isn’t a moral critique. There’s plenty of subjectivity in private company valuations, and every GP faces pressure to lean optimistic during a fundraise. But for LPs, it creates a real dilemma.
When you’re evaluating a manager’s track record, how do you know if that company marked at 12x EBITDA should really be 12x? Or 10x? Or 14x? Fair marks matter enormously when you’re allocating capital - but the information asymmetry makes it almost impossible to validate with confidence.
The Traditional Approaches (and Why They Fall Short)
The Market Comparables Rabbit Hole
The textbook answer is to build comparable company analyses - look at public markets, gather private transaction data, and benchmark away. In practice, this approach is a minefield:
Data quality is inconsistent, especially for private comparables
Finding truly comparable companies is harder than it seems
Revenue growth rates, margin profiles, and business models rarely align perfectly
You end up spending weeks building peer groups for each portfolio company
And frankly, I don’t think this is the job of an LP. You're not the valuation agent. And even if you invest the time, poor peer selection can lead you to validate numbers that shouldn't be validated - or question marks that are perfectly reasonable.
The Deep Dive Trap
The alternative is to go deep with the GP on each company - really understand the underlying performance, the growth drivers, the strategic initiatives. This sounds good in theory.
The problem? Confirmation bias is a powerful force. If you already like and trust the manager, you'll tend to find their narratives compelling and their projections credible. If you're skeptical of them, you'll poke holes in everything they say. Either way, you're not getting to objective truth - you're reinforcing your priors.
As first demonstrated by Peter Wason in the 1960s, confirmation bias is the tendency to favor information that confirms our existing beliefs while overlooking evidence that contradicts them.
A Better Way: The Entry Multiple Test
Here's a simpler, faster approach that I've found to be remarkably predictive: Compare the entry multiple paid for each company to its current valuation multiple.
That's it. No complex peer analysis. No deep strategic reviews. Just entry multiple vs. current multiple across the portfolio.
Now, let me be clear: it's perfectly fine - expected, even - for some companies to be marked at higher multiples than entry. Strong revenue growth, margin expansion, or a fundamental improvement in business quality can all justify multiple expansion. You can usually spot these cases quickly from the GP's investment memos and portfolio updates.
🚩 The Red Flag Pattern
What should make you nervous is when you see systematic multiple expansion across most of the portfolio - particularly 1-2 turn write-ups on companies showing limited or no underlying growth.
This pattern is especially pronounced in companies that were:
Held at 1.0x cost
Written up slightly (say, 1.2x-1.3x cost)
Showing flat or declining revenues
Not demonstrating any clear business quality improvement
In my experience, these are the exact companies that get marked down to 0.5x-0.75x immediately after the fundraise closes. The timing tells you everything you need to know.
But once you’ve committed to their next fund, there’s nothing you can do about it.
There’s a lot more to unpack - especially how to handle GP pushback once you spot this pattern. So, we’ve split this piece in two.
Next week: how to respond when managers defend their marks - and what separates elite / top-decile valuation GPs from the rest.
How did you like today's post?
💰 A quick intel snapshot of recently raised funds
Another relatively slow week, with only 5 fund closings announced.
Patria Infrastructure Fund V: $2.9bn (infrastructure, Latin America)
Diversis Capital Partners III: $1.2bn (lower-middle-market control buyout, software & tech-enabled services, North America)
BoxGroup Seven & BoxGroup Leaven: $550m combined (early-stage venture & follow-on opportunity fund, US-focused)
Lifeline Ventures Fund VI: €400m (early-stage venture, Europe)
HighVista Venture Capital Fund XIV: $270m (venture fund of funds - early-stage fund manager investments, global)
One final thing…
If you enjoyed this newsletter, I’d appreciate it if you would forward it to a colleague or friend. If you’re that friend, welcome!
Written by

Steffen Risager
This newsletter is written by Steffen Risager, the founder of FundFrame, a platform for LPs to manage their private markets investments.
Before that, Steffen was CIO at Advantage Investment Partners, a Danish Fund-of-Funds.
Steffen has a decade of experience as an LP, and has made commitments totaling approx. $6bn across fund- and co-investments.

